In short: Teravoxel volume electron microscopy datasets from neural tissue can now be acquired in weeks, but data analysis requires years of manual labor (see also Fig. 1). The SyConn framework uses deep convolutional neural networks (CNN) and random forest classifiers (RFC) to infer a richly-annotated synaptic connectivity matrix from manual neurite skeleton reconstructions by automatically identifying mitochondria, synapses and their types, axons, dendrites, spines, myelin, somata and cell types.
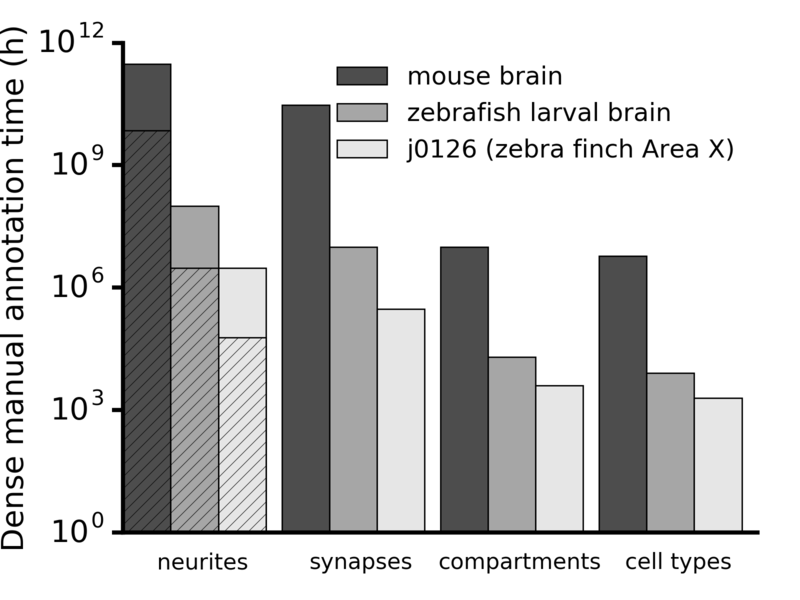
Fig. 1: Estimated times for the dense manual annotations of all individual steps required for acquiring a wiring matrix from EM datasets. Hatched bars are skeletonization times. Volumes: j012 (songbird Area X): 0.00108 mm³; zebrafish larval brain: 0.048 mm³ 45; mouse brain, grey matter: 112 mm³.
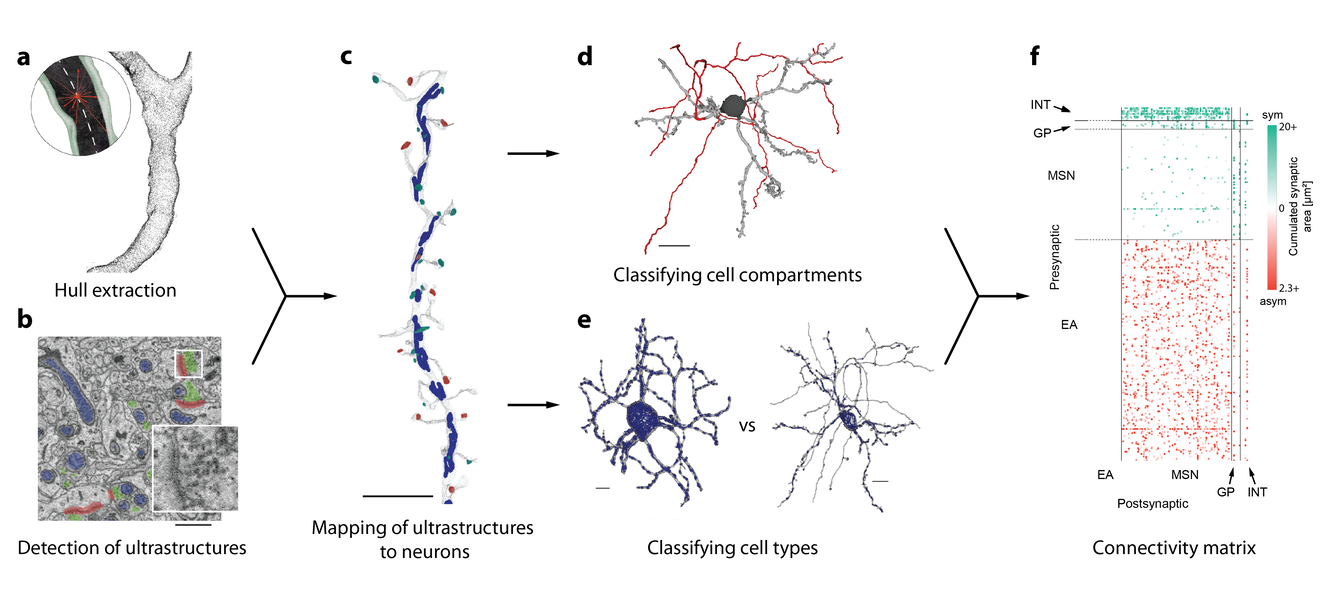
SyConn automates all steps shown in Fig. 1, but the neurite reconstruction, where it only requires manual skeleton reconstructions instead of volume segmentations (compare hatched bars and full bars in Fig. 1). Using several recursive 3D CNNs we first detect cell boundaries and all kinds of ultrastructures such as synaptic junctions (Fig. 2b). Using a ray cast approach we extract a hull for each skeleton based on the boundary prediction (Fig. 2a), which is then used to map mitochdondria, synaptic junctions and vesicle clouds to each cell (Fig. 2c). Leveraging this information SyConn uses RFCs to partition neurons into their subcellular parts (axon, dendrite, soma; Fig. 2d) and to assign them to one of four broad cell types (Fig. 2e). Finally, we combine this into a richly annotated synaptic connectivity matrix (Fig. 2f).
Fig. 2: Workflow of SyConn with the most important steps. Inputs are the raw data and manually traced skeletons. The hull in (a) is extracted with a ray casting approach based on a barrier map from a 3D CNN. Ultrastructures in (b) refer to synaptic junctions (red), vesicle clouds (green) and mitochondria (blue), which were also inferred by a 3D CNN. The cell in (d) was automatically partitioned in axon (red), dendrite (light gray) and soma (dark gray) using an RFC. Cells in (e) are GP (left) MSN (right) and shown with their mitochondria (blue). The connectivity matrix in (f) encodes cumulated synaptic area between each cell pair.
To test SyConn, we detected ultrastructural objects in three serial block-face electron microscopy (SBEM) data sets (zebra finch Area X, size: 97.9 × 95.6 × 115 μm³; zebrafish spinal cord, size: 81.8 × 89.9 × 210 μm³; mouse striatum, size: 17.9 × 15.0 × 69 μm³) and created a wiring diagram of the zebra finch basal-ganglia (Area X) from 612 skeleton reconstructions traced with KNOSSOS (knossostool.org).
Getting Started
Python 2.7 is required (we recommend Anaconda). SyConn has been tested on Linux distributions (CentOS and Arch Linux).
Quickstart
1
2
3
4
5
6
git clone https://github.com/StructuralNeurobiologyLab/SyConn
cd SyConn
pip install-r requirements.txt --upgrade# Run the example (with sample data from the link on top of this page):
All requirements should be automatically installed, when following the instructions. Together with the provided sample data (SyConnDenseCube.zip) including our trained models one is able to run most parts of SyConn.
Ground Truth
The provided sample package contains trained CNNs, but no ground truth. Ground truth can be downloaded from the provided links below. The readme file in the zip container explains how the ground truth was used for training in SyConn.
SyConn was published in Nature Methods. If you use parts of this code base in your academic projects, please cite the corresponding publication.
BibTex
@ARTICLE{SyConn2017,
title ="Automated synaptic connectivity inference for volume electron
microscopy",
author ="Dorkenwald, Sven and Schubert, Philipp J and Killinger, Marius F
and Urban, Gregor and Mikula, Shawn and Svara, Fabian and
Kornfeld, Joergen",
abstract ="SyConn is a computational framework that infers the synaptic
wiring of neurons in volume electron microscopy data sets with
machine learning. It has been applied to zebra finch, mouse and
zebrafish neuronal tissue samples.",
journal ="Nat. Methods",
publisher ="Nature Publishing Group, a division of Macmillan Publishers Limited. All Rights Reserved.",
year = 2017,
month = Feb,
day = 27,
url = http://dx.doi.org/10.1038/nmeth.4206
}
Contributors
Sven Dorkenwald
SyConn development and evaluation
Marius Killinger and Gregor Urban
ELEKTRONN development.
Philipp Schubert
SyConn development and evaluation
Fabian Svara and Shawn Mikula
Dataset contributions
Jörgen Kornfeld
SyConn development and evaluation
SyConn v1 was developed in the Denk department at the MPI for Medical Reserach in Heidelberg. The current version is being developed in the Kornfeld lab at the MPI of Biological Intelligence (in foundation) in Martinsried, Germany.
References
SyConn makes use of the ELEKTRONN neural network toolkit (elektronn.org) and the KNOSSOS Python tools (github). Neuroglancer and KNOSSOS (knossostool.org) are used for visualization and annotation of 3D EM data sets.